Technology Strategy Made Clear
Plan, manage, and communicate your technology strategy with confidence. Built for CTOs, architects, and engineering leaders who need to align technology decisions with business goals.
Build Your Tech Radar — Free
Try our interactive tech radar builder. Add your technologies, visualize your stack, and make strategic decisions. No signup required.
Try the Free Radar Builder →Choose Your Path
Nervespan adapts to how you work. Find the capabilities that matter most to your role.
Executive Strategy
Bridge the communication gap with the board. Turn your technology landscape into compelling, data-driven narratives that resonate with non-technical stakeholders.
- Strategy Deck Generation with point-in-time snapshots
- AI-Powered Portfolio Insights
- BCG & Ansoff Matrix Analysis
Architectural Governance
Manage technical sprawl before it manages you. Track every component, lifecycle, and decision record in one place with continuous health visibility.
- EOL & Lifecycle Tracking
- Architecture Decision Records
- Health Matrices & Score Rings
Operational Velocity
Justify architectural investments with hard data. Measure delivery performance and infrastructure quality against industry benchmarks.
- DORA Metrics Tracking
- Cloud Well-Architected Scoring
- Portfolio-Level Composite Scores
Built for How You Work
Explore the capabilities that matter most to your role
Communicate strategy with confidence
Turn your technology landscape into compelling, board-ready narratives. Nervespan generates presentation decks from your latest data so you never have to manually assemble slides again.
-
Strategy Deck Generation Build presentation-ready decks with point-in-time snapshots, diagrams, and visualizations. Publish and share via secure links or export to PPTX.
-
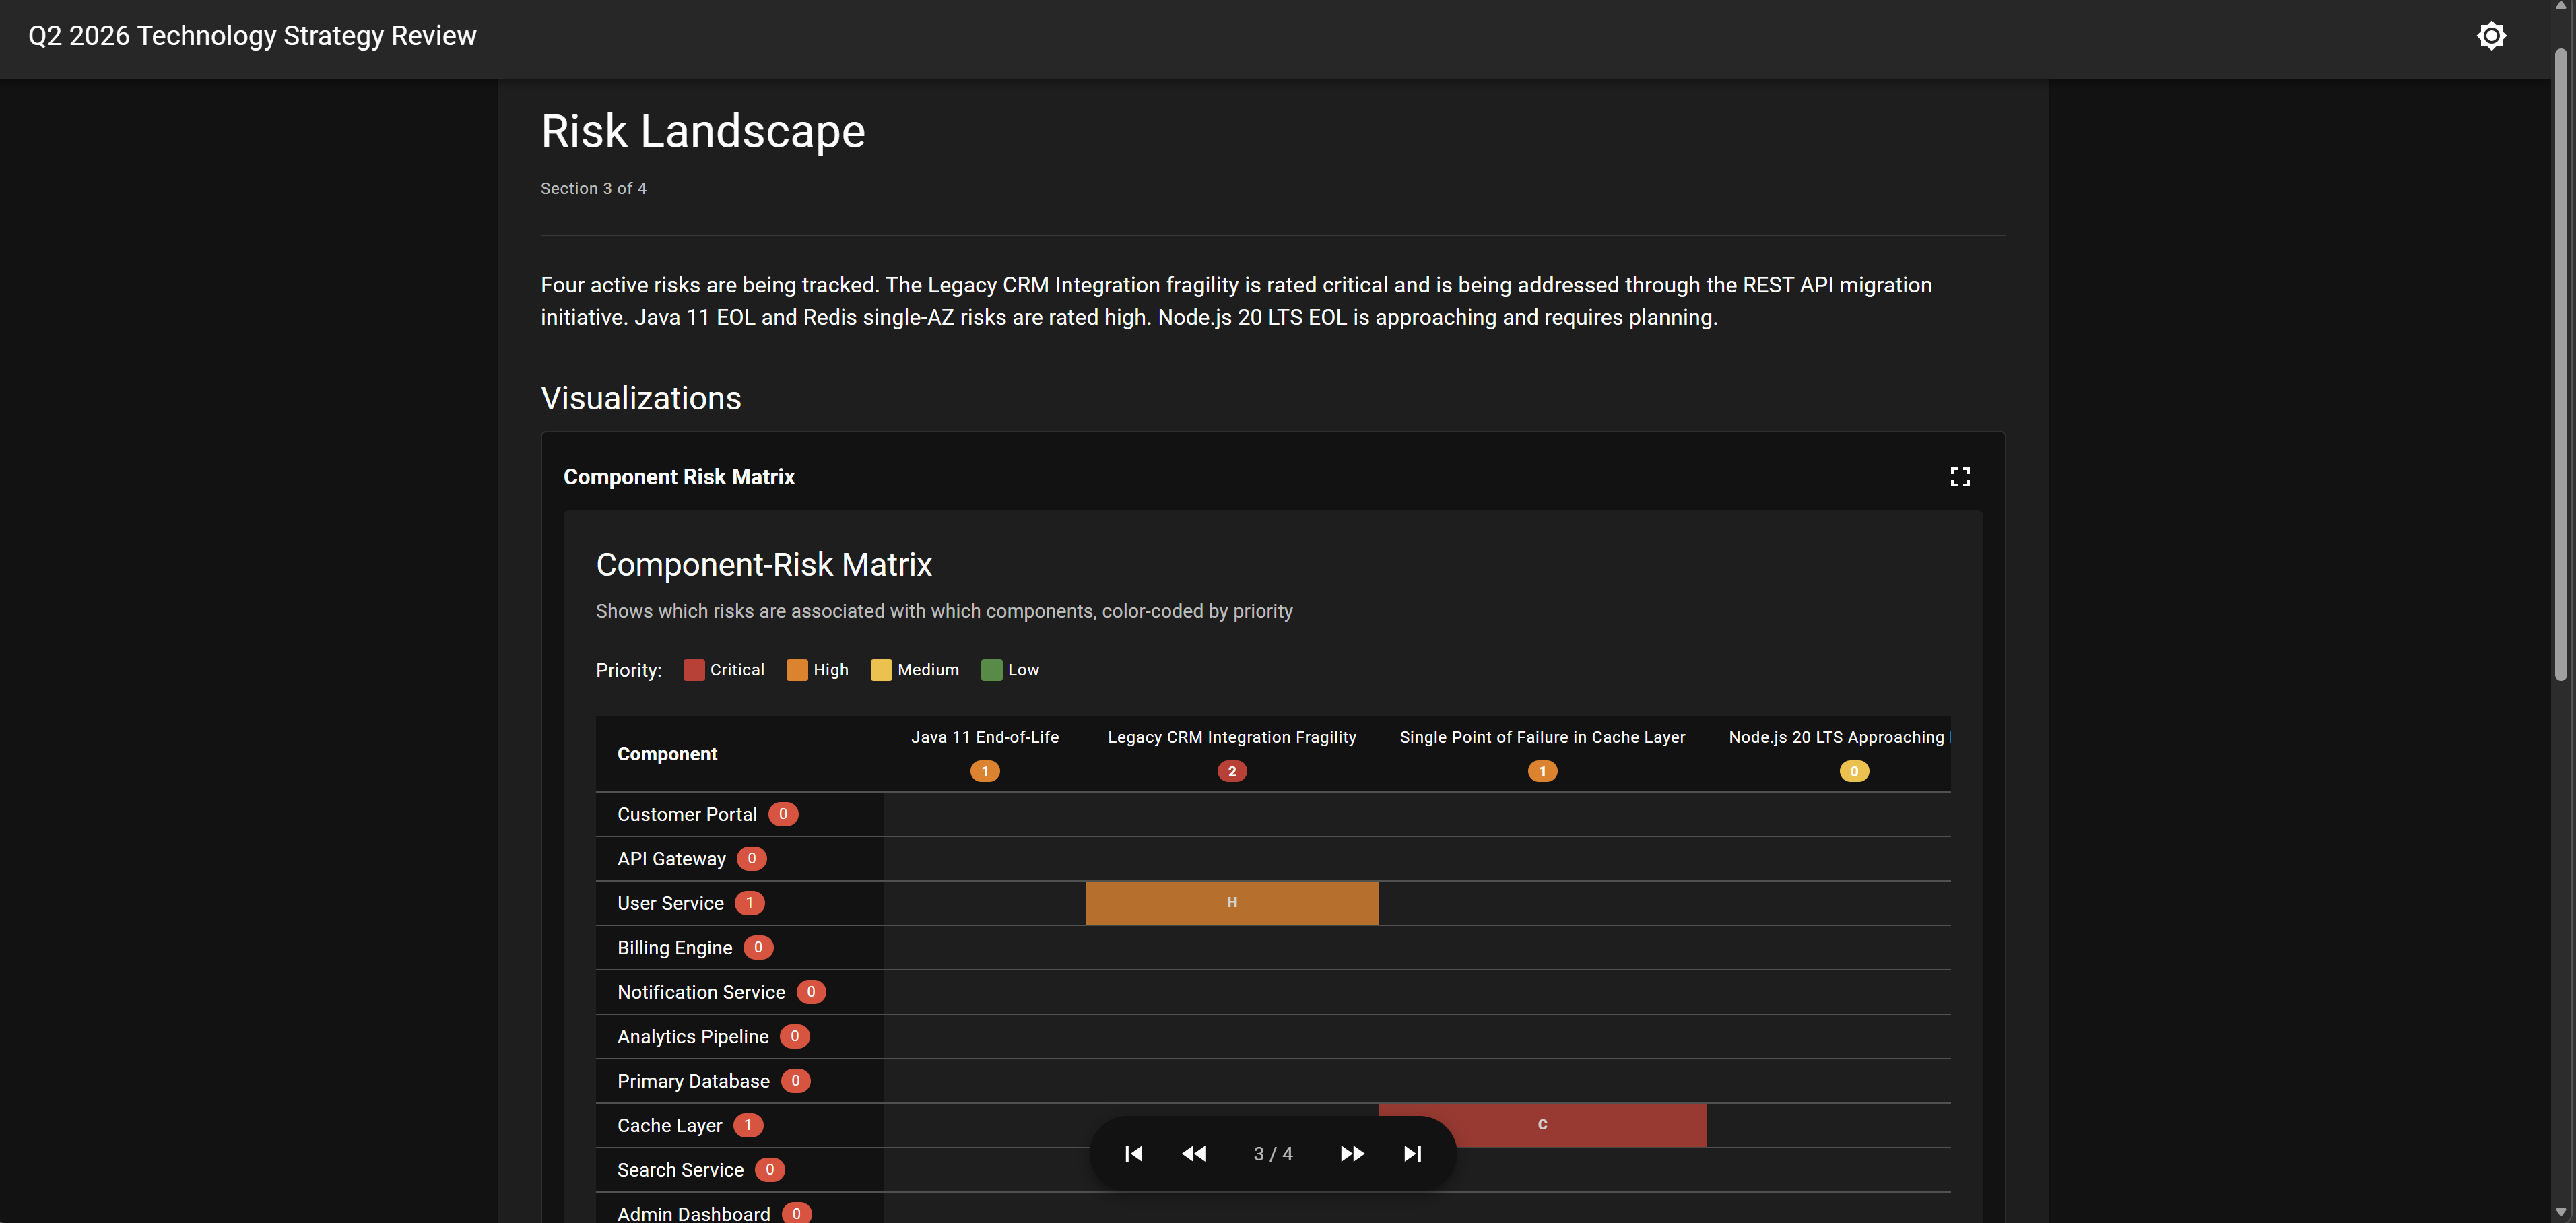
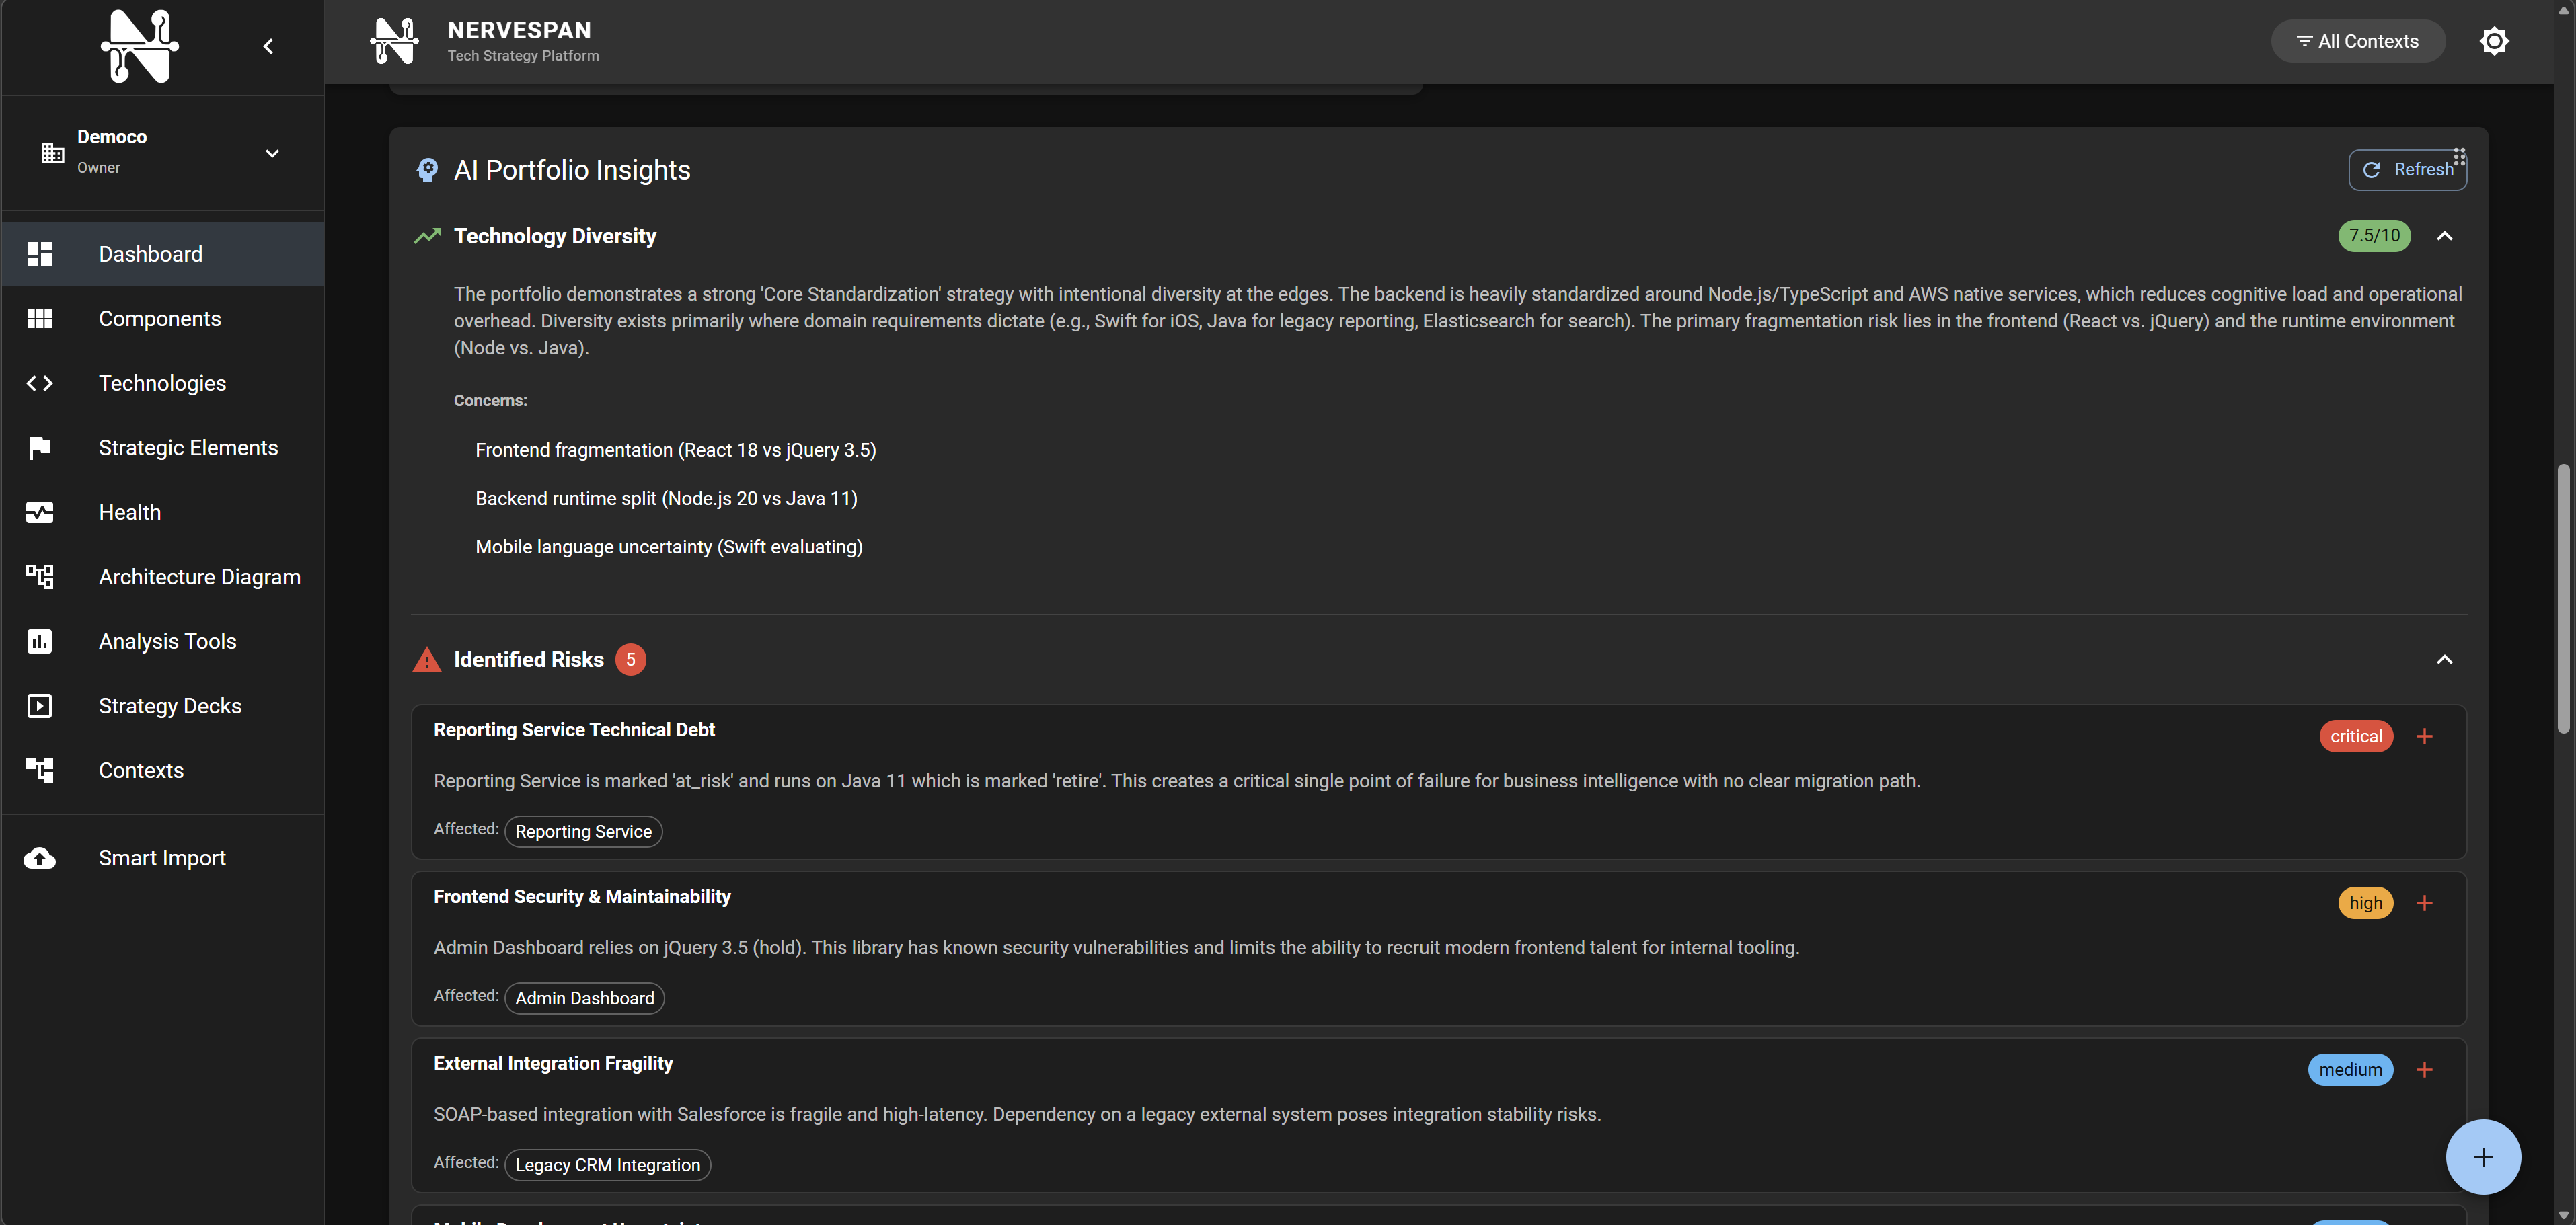
AI-Powered Portfolio Insights Get intelligent analysis of your technology portfolio with risk assessments, opportunity identification, and strategic recommendations.
-
BCG & Ansoff Matrix Analysis Apply proven strategic frameworks to your technology portfolio. Visualize investment priorities and growth strategies at a glance.
-
Stakeholder Sharing Share decks via secure links and let stakeholders view your strategy without needing an account. Each deck captures a snapshot so you can track how your strategy evolves over time.
Govern your architecture at scale
Track every component, lifecycle, and decision record in one place. Get up-to-date health visibility across your entire technology landscape with score rings and trend indicators.
-
EOL & Lifecycle Tracking Track library versions and end-of-life dates across your portfolio. Get timeline views, risk summaries, and early warnings before technologies go unsupported.
-
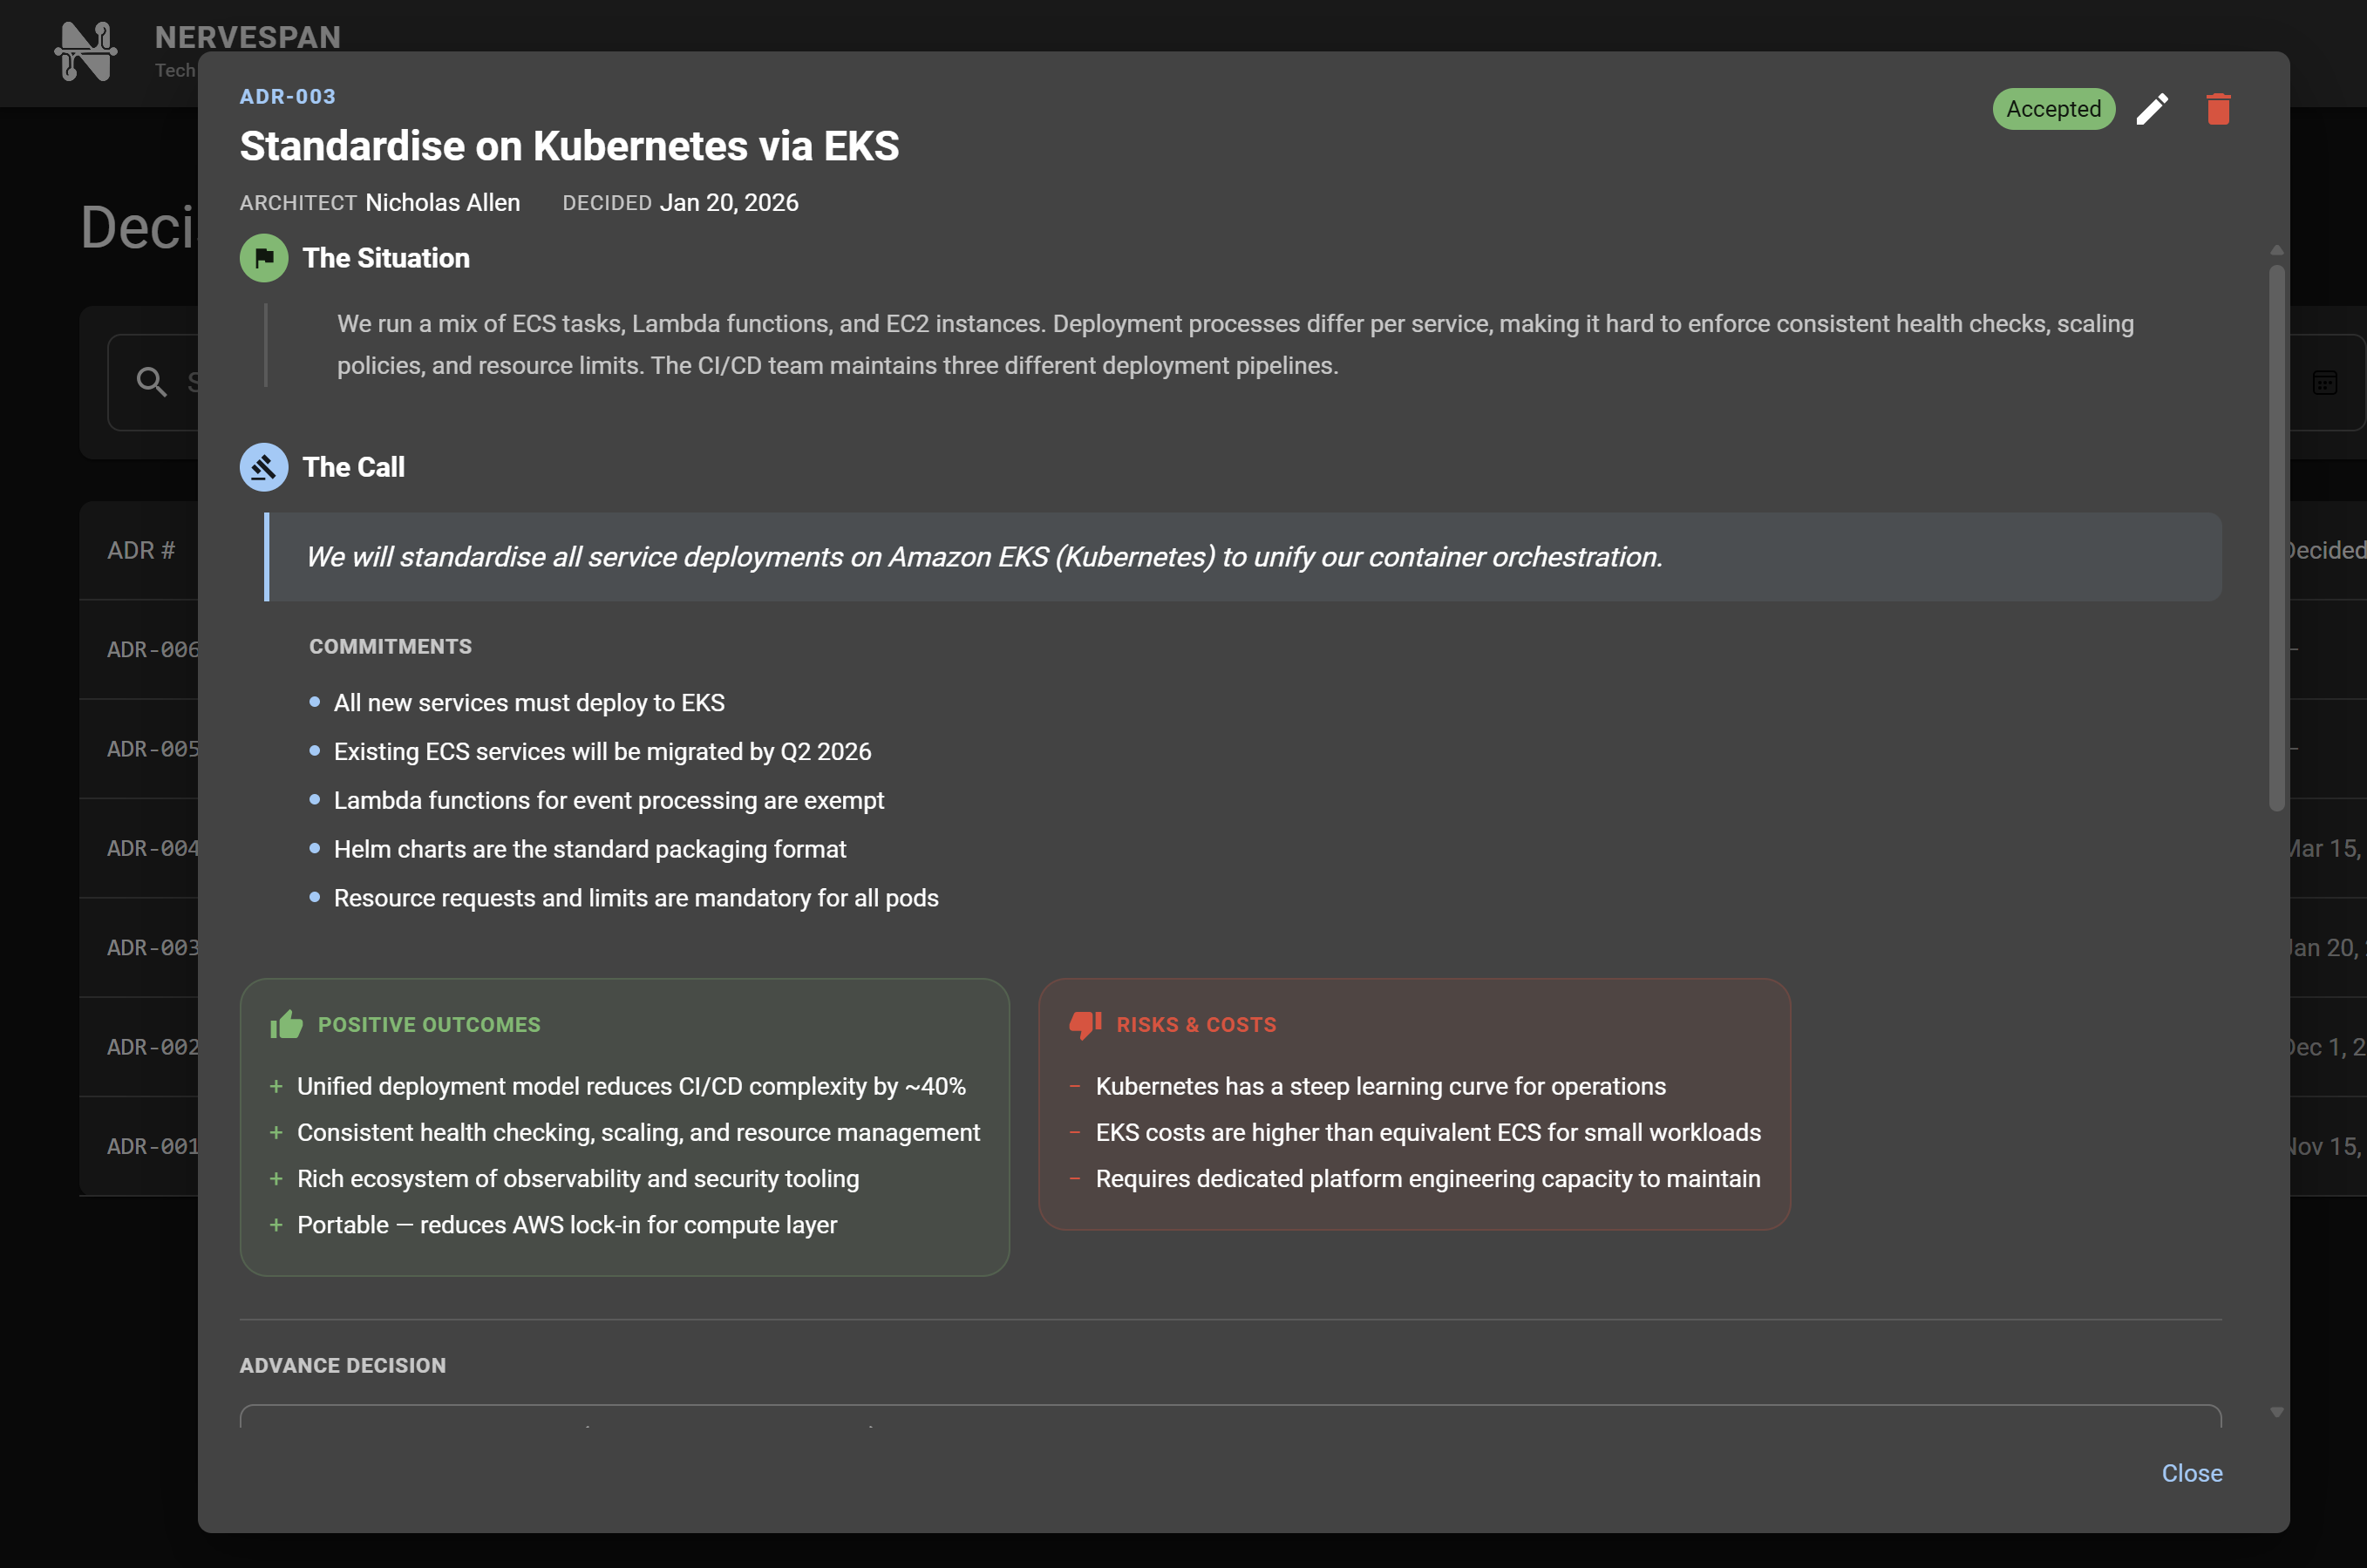
Architecture Decision Records Capture architectural decisions with structured situation, decision, and trade-off analysis. Link ADRs to components and technologies, track status from draft through accepted, and build a searchable history of your architecture's evolution.
-
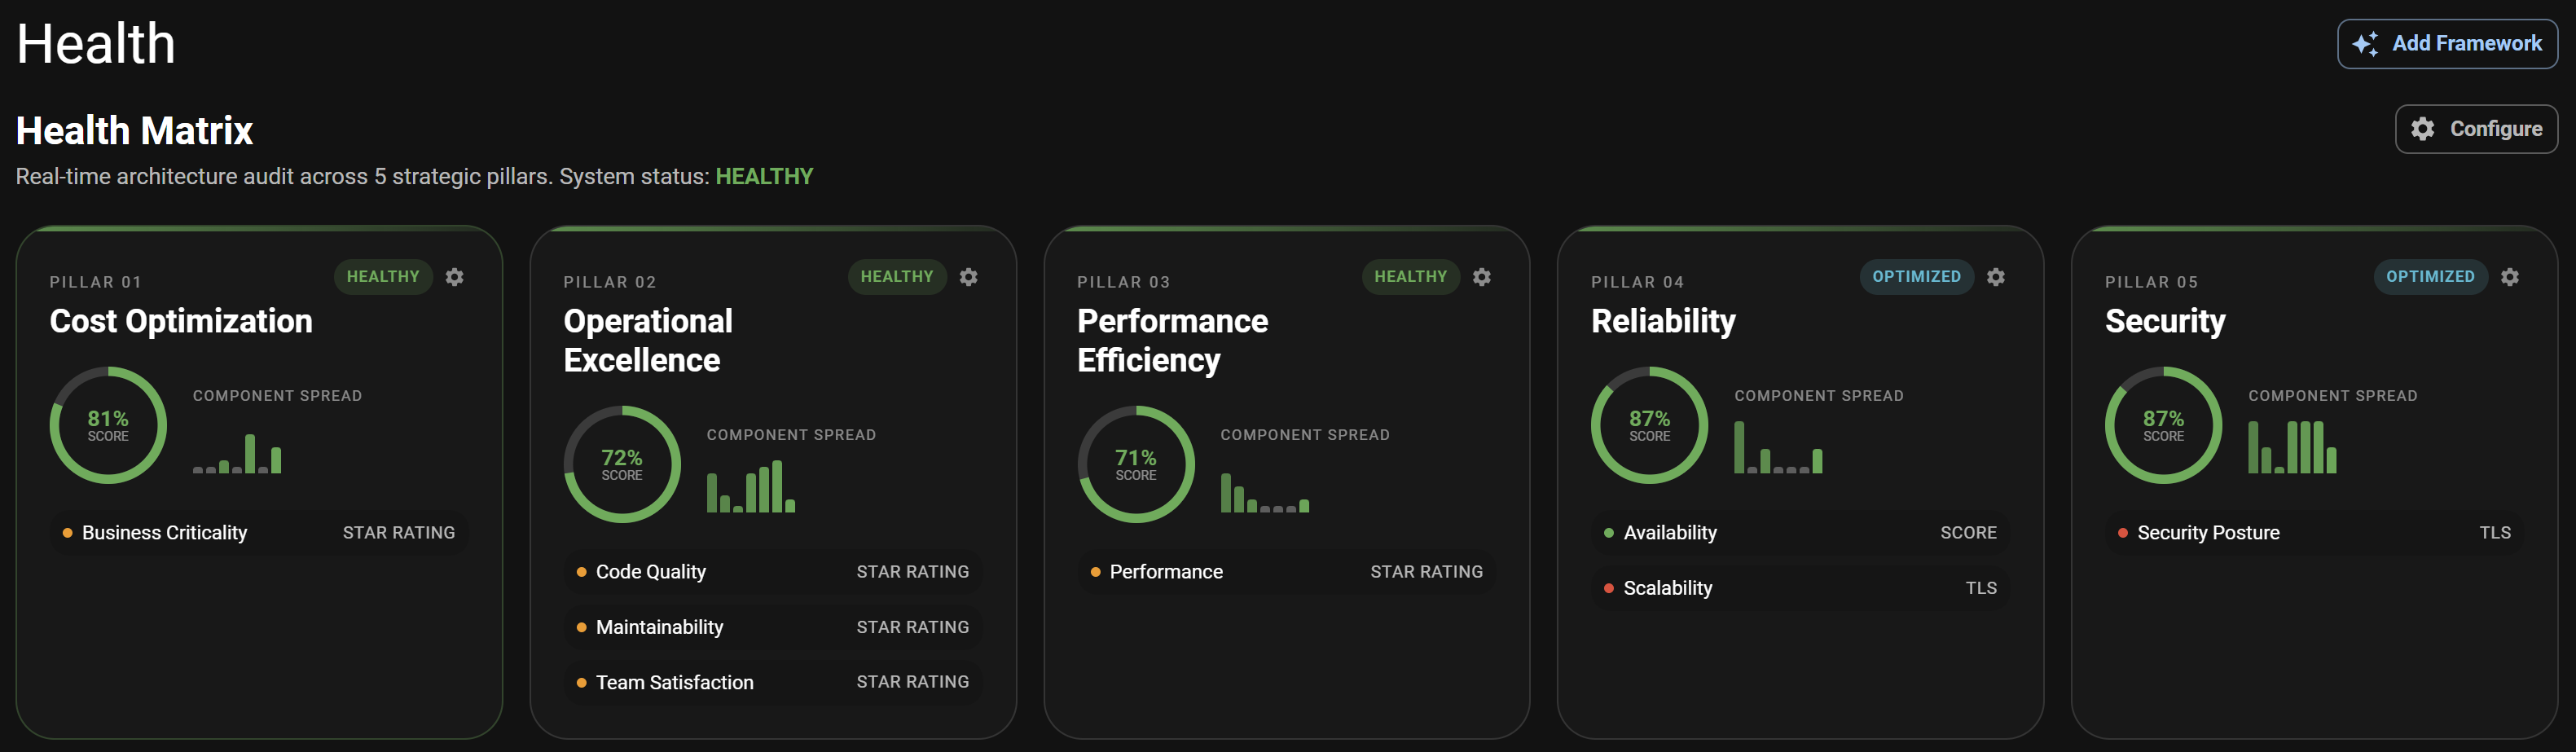
Health Matrices & Score Rings Define health pillars using DORA, Cloud Well-Architected, or bespoke models. Visualize scores across every component in an up-to-date matrix.
-
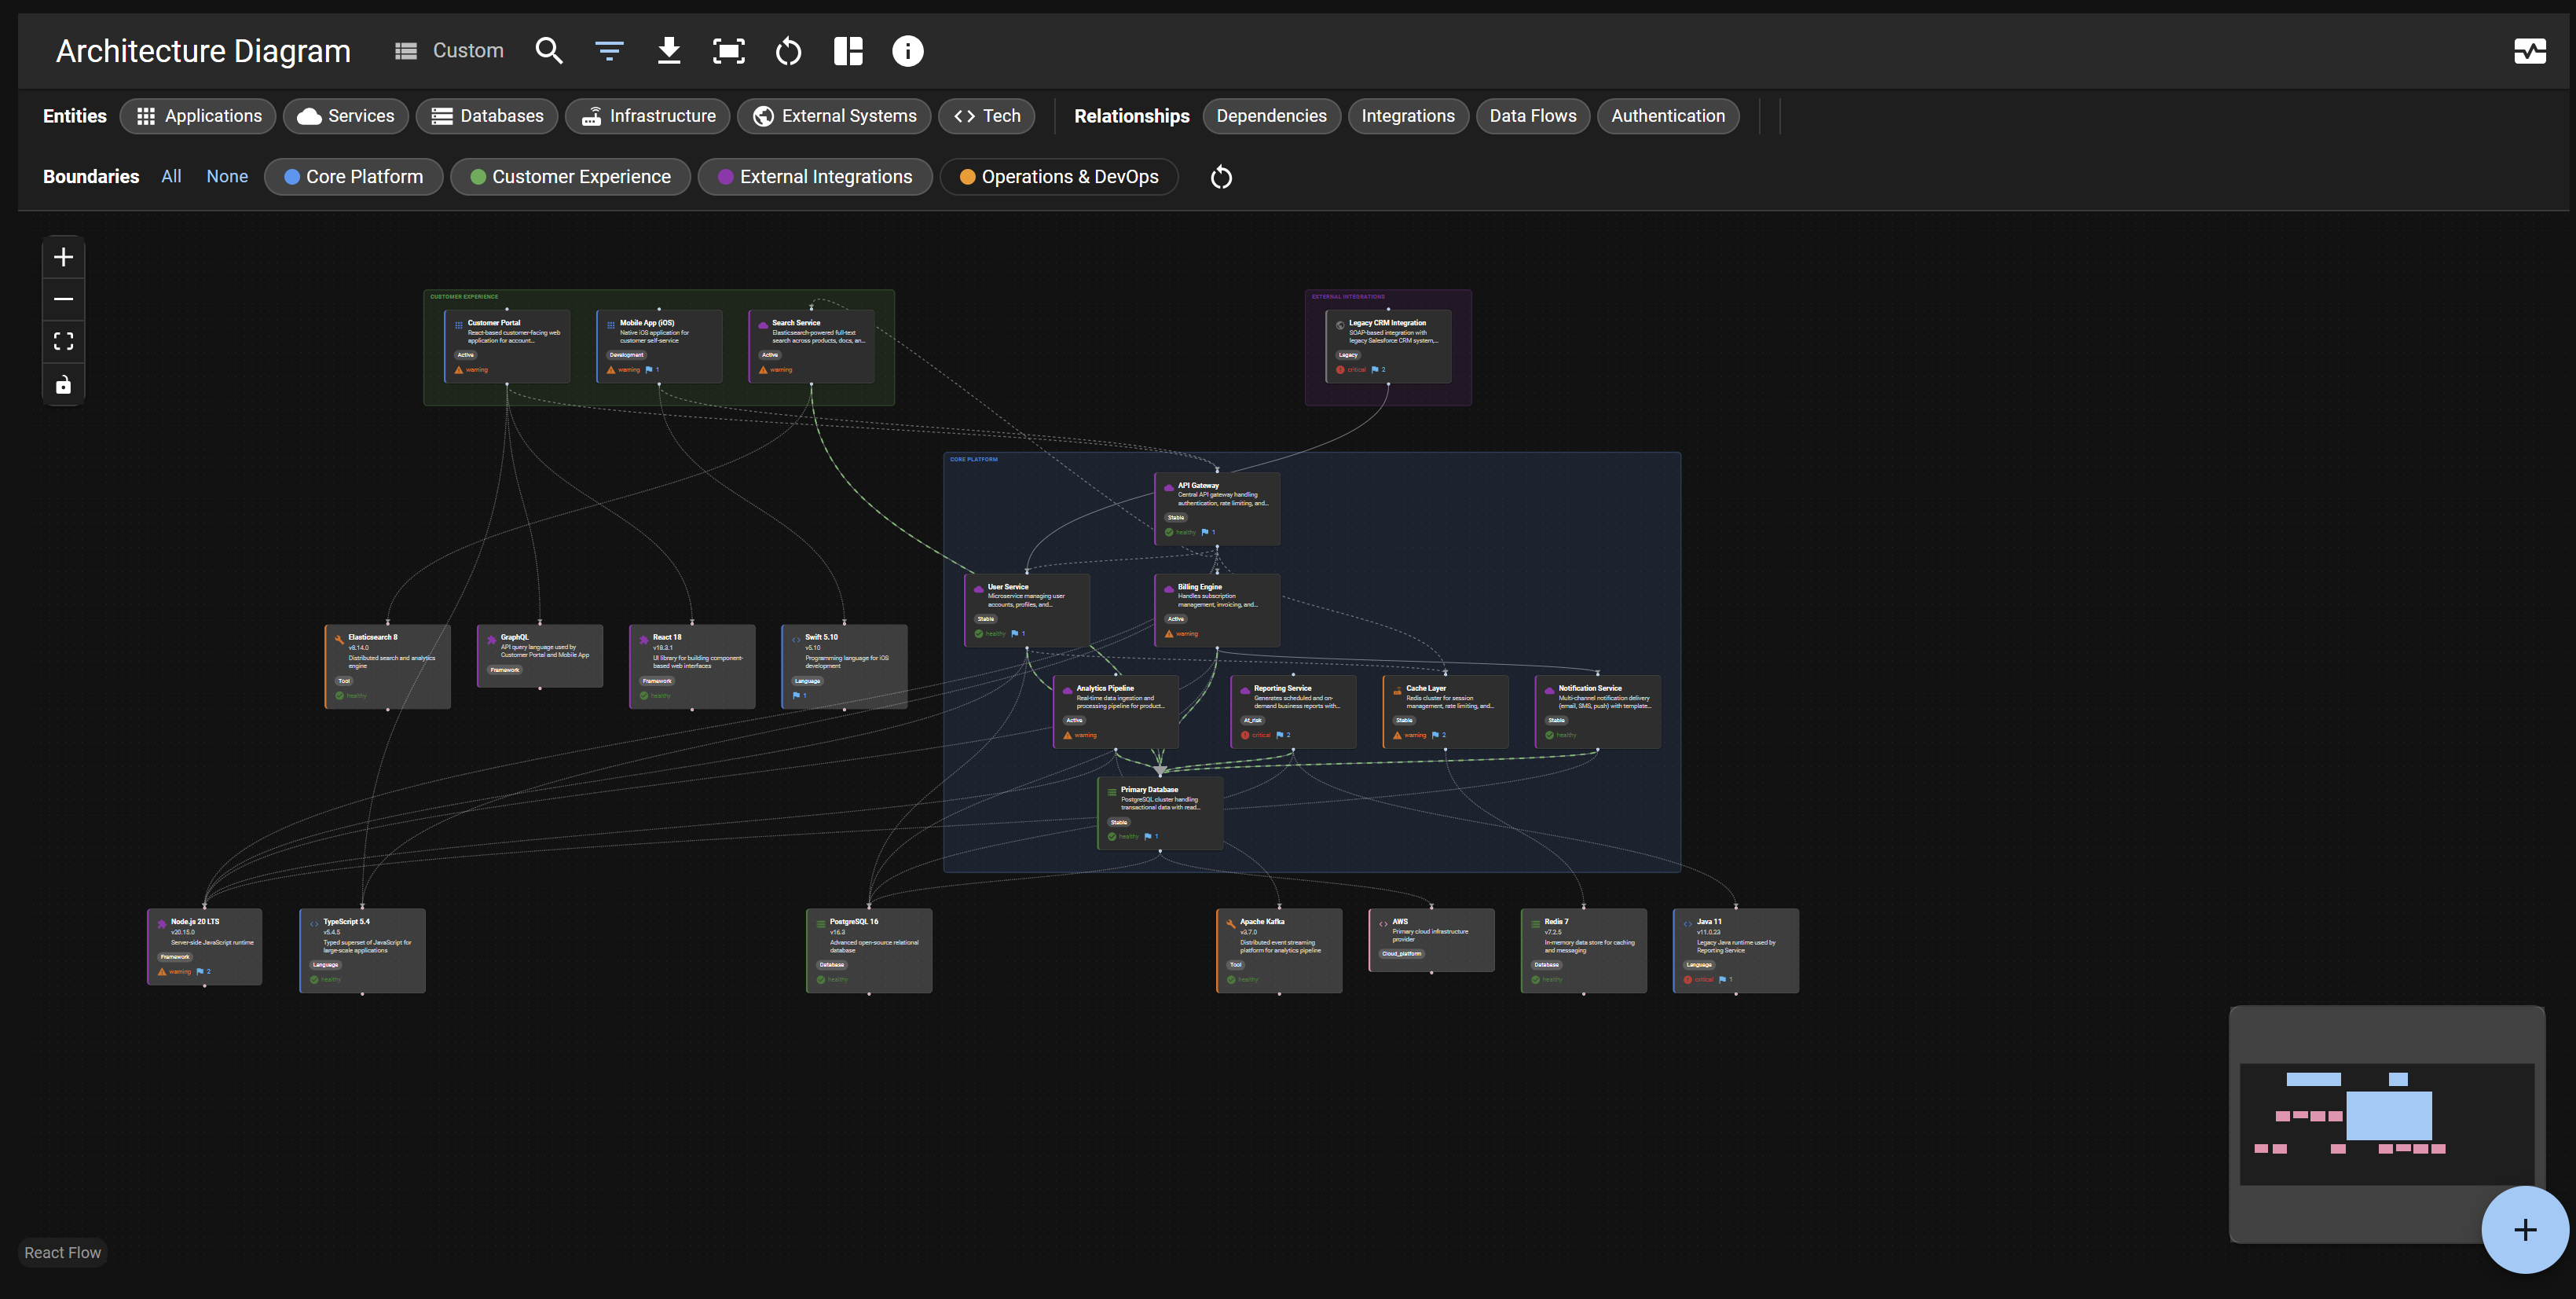
Component Relationships & Diagrams Model dependencies, hierarchies, and domain boundaries. Visualize your system architecture with interactive, saveable diagram views.
-
Technology Radar Plot technologies across Adopt, Trial, Assess, and Hold rings. Track adoption status, spot duplication, and align your stack with strategic direction.
Measure what matters
Justify architectural investments with hard data. Track delivery performance and infrastructure quality against industry benchmarks, and surface portfolio-level trends that drive engineering decisions.
-
DORA Metrics Tracking Measure deployment frequency, lead time, change failure rate, and recovery time. Benchmark against industry standards with clear trend visualizations.
-
Cloud Well-Architected Scoring Score your architecture against cloud provider frameworks. Track operational excellence, security, reliability, performance, and cost optimization.
-
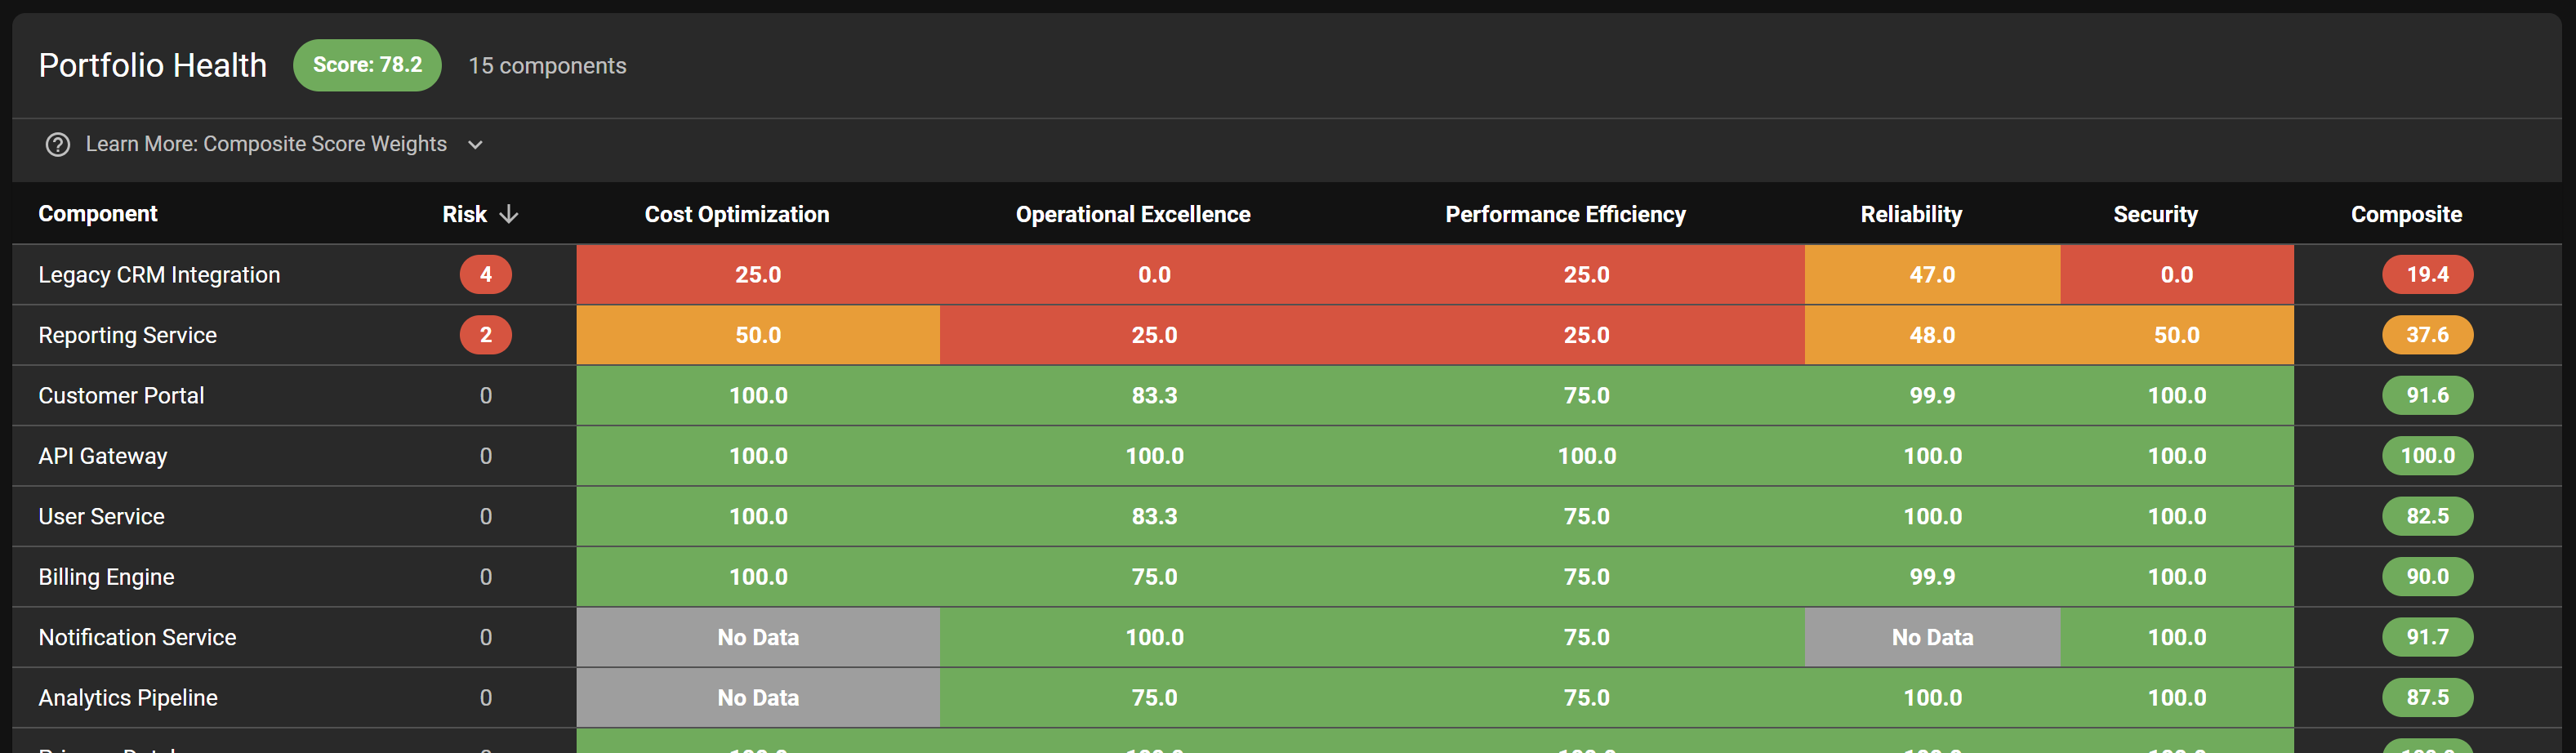
Portfolio-Level Composite Scores Aggregate health metrics across your entire portfolio. Identify systemic risks and track improvement trends over time with composite scoring.
-
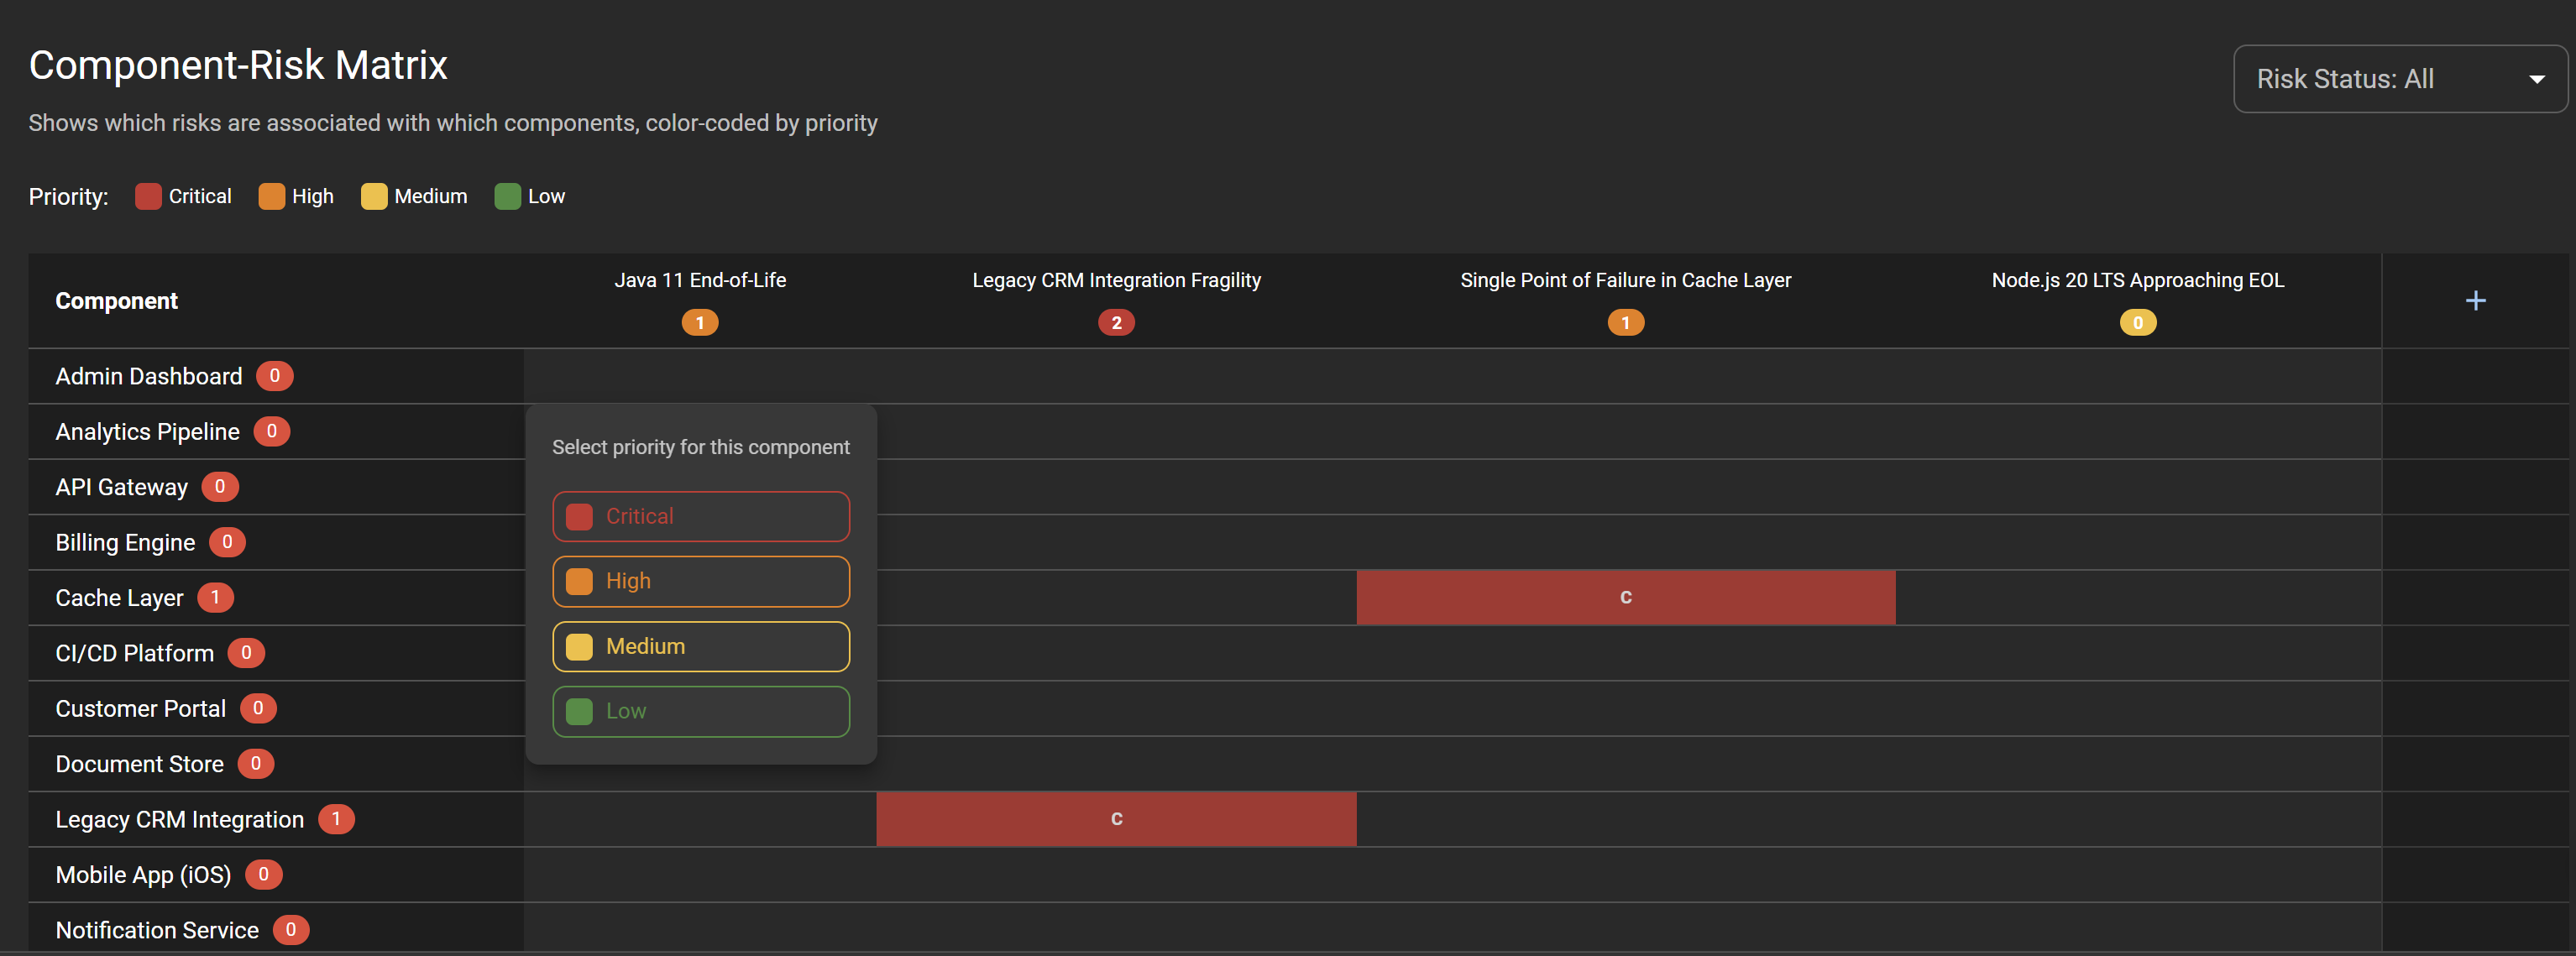
Risk Matrix & Component Radar Visualize risk exposure across components with matrix views. Use radar charts to compare component health dimensions at a glance.
Latest from the Blog
Thinking on technology strategy, architecture, and engineering leadership
Simple, Transparent Pricing
Try free for 30 days, then pick the plan that fits
- ✓ Up to 100 components
- ✓ 1 managed sync (Jira or GH)
- ✓ 10 AI credits /mo
- ✓ Unlimited decks & snapshots
- ✓ Shareable links + PDF
- ✓ 1 user + 5 viewers
- ✓ Email support
- ✓ Unlimited components
- ✓ Unlimited syncs
- ✓ 500 AI credits /mo
- ✓ Unlimited decks & snapshots
- ✓ PPTX + shareable decks
- ✓ Unlimited users
- ✓ Priority support
- ✓ Unlimited components
- ✓ Custom connectors
- ✓ Unlimited AI
- ✓ Unlimited decks & snapshots
- ✓ Full API + BI export
- ✓ Unlimited users
- ✓ Dedicated account manager
Ready to Transform Your Technology Strategy?
Join forward-thinking technology leaders who trust nervespan
Get Started Today